
The Crypto Market Cap (TOTALCAP) and Bitcoin (BTC) trade above long-term Fib resistance levels. Mantle (MNT) trades at an all-time high.
In the news today:
- Michael Saylor’s MicroStrategy X account was hacked, costing $440,000 in stolen funds.
- Saifedean Ammous, the author of the Bitcoin Standard, is exposing financial advisor’s hypocrisy towards Bitcoin.
TOTALCAP Closes Above Critical Resistance
The cryptocurrency market cap has increased considerably in the past three weeks, creating successive bullish weekly candlesticks.
After moving above the 0.382 Fib retracement resistance level at $1.61 trillion, TOTALCAP increased and closed above the 0.5 Fib retracement resistance level of $1.88 trillion. If the upward movement continues, the next resistance will be at $2.10 trillion, 9% above the current price.
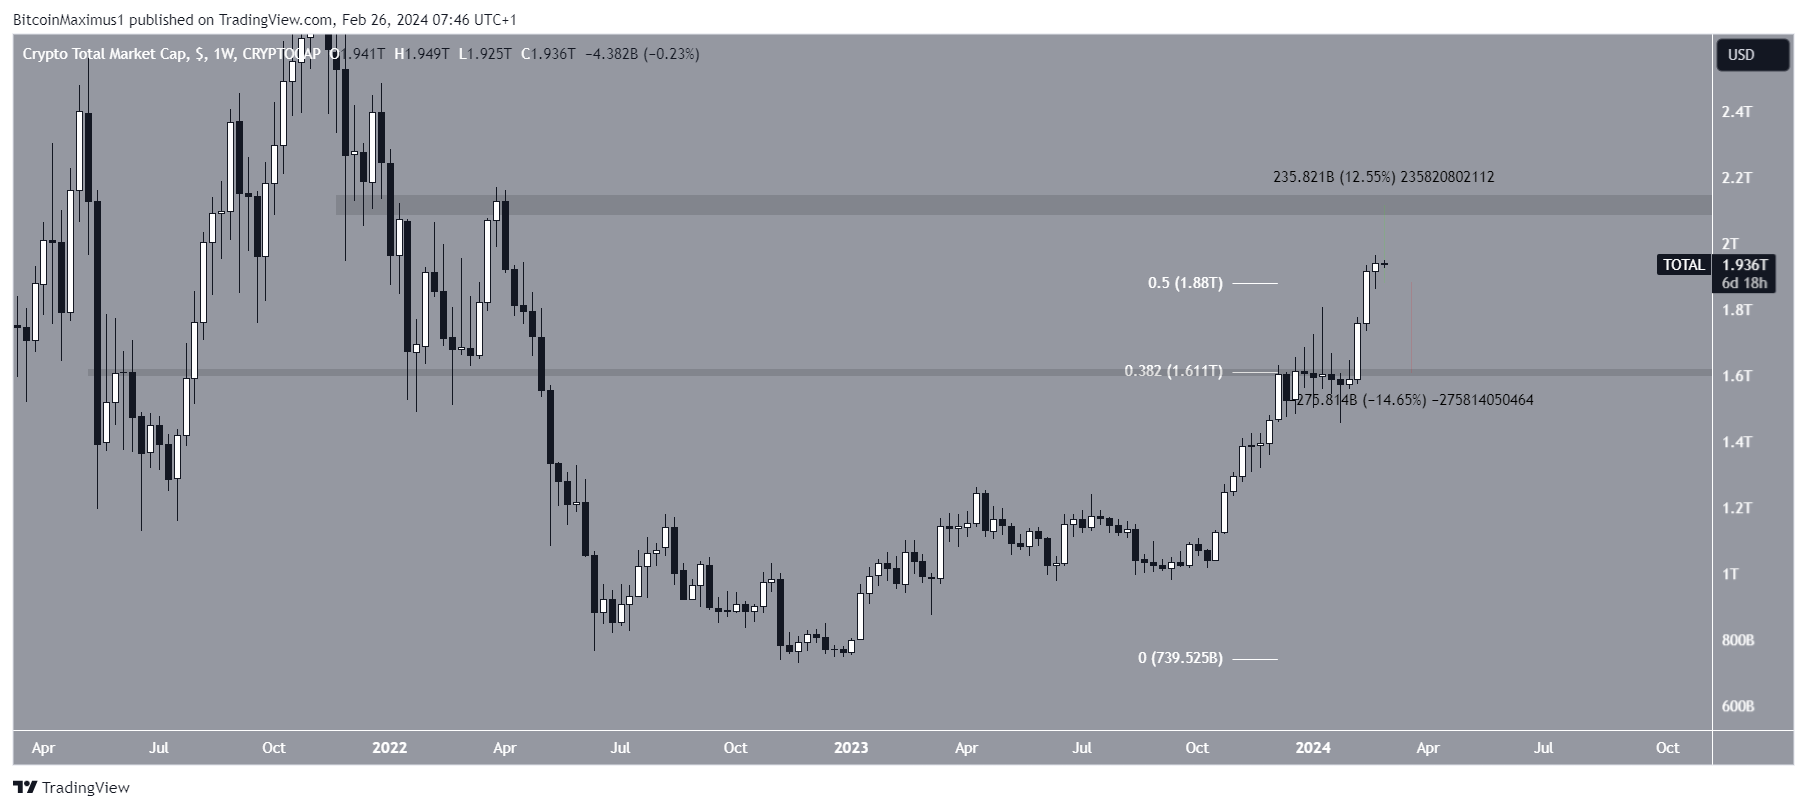
Despite the bullish TOTALCAP price prediction, closing below the 0.5 Fib retracement resistance level can trigger a 17% drop to the closest support at $1.61 trillion.
Bitcoin Upward Movement Stalls
Similarly to TOTALCAP, the Bitcoin price has increased since the start of January. The upward movement led to a high of $53,000 in February, the highest since 2021. This also led to a close above the 0.618 Fib retracement resistance level of $48,640.
Despite the bullish BTC price action, it is worth mentioning that the weekly Relative Strength Index (RSI) shows weakness. While TOTALCAP’s RSI invalidated its bearish divergence, Bitcoin’s did not, confirming it with last week’s close.
After five successive bullish candlesticks, the BTC price created its first bearish candlestick last week. If BTC does not close below the 0.618 Fib retracement resistance level, it can increase to the next resistance at $65,000, 25% above the current price.
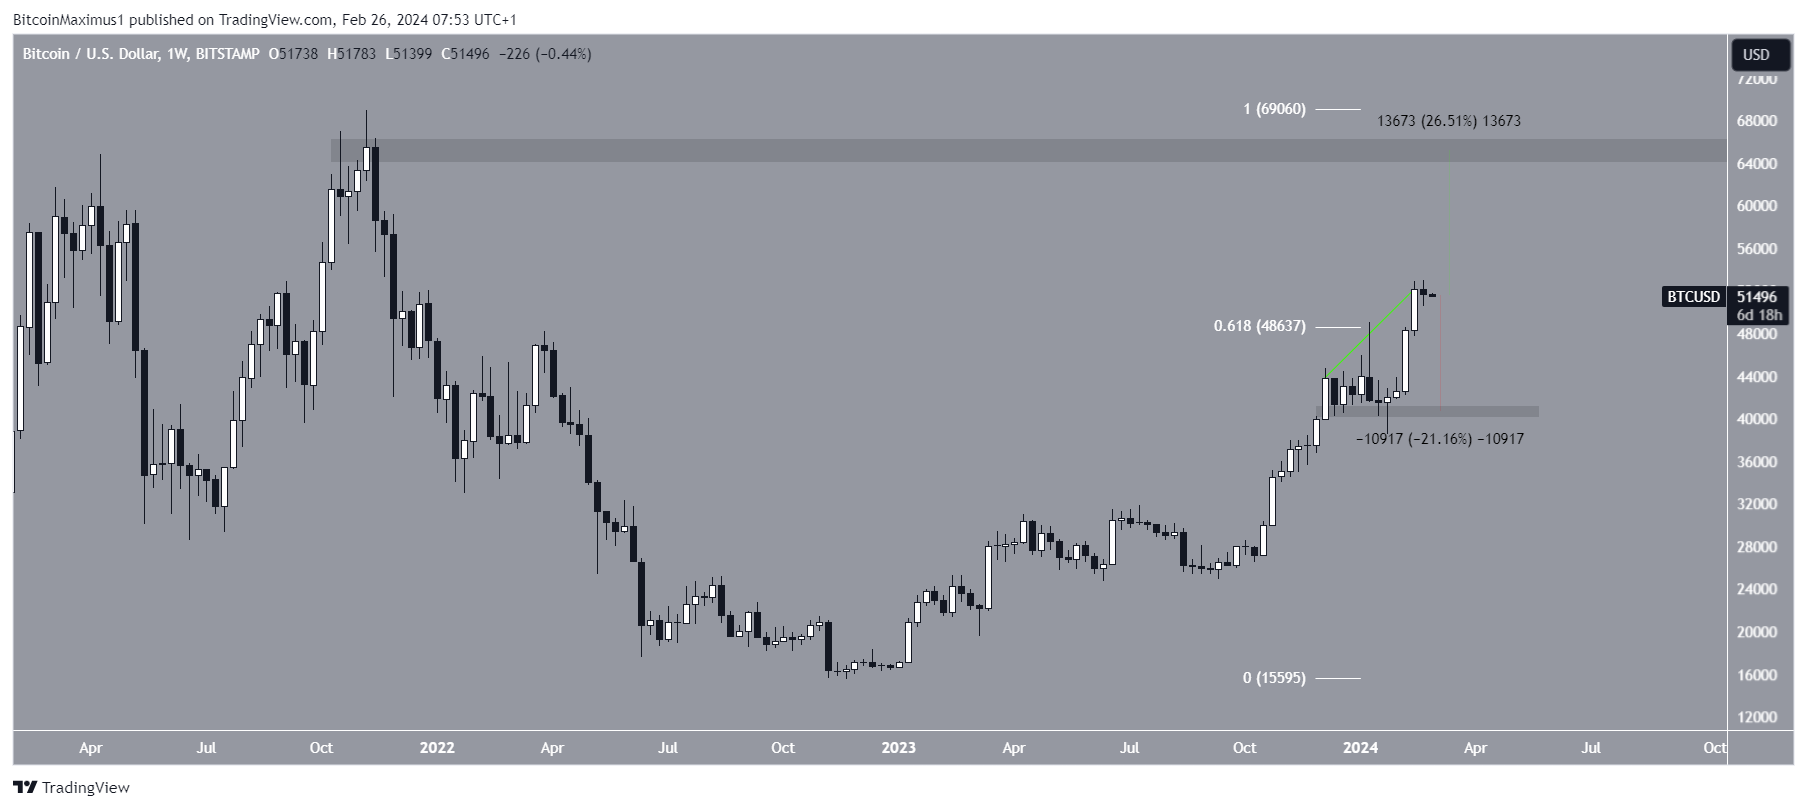
Despite the bullish BTC price prediction, a close below $48,600 can trigger a 22% drop to the closest support at $40,600.
MNT Reaches All-Time High
The MNT price has increased swiftly since the start of January. Initially, it encountered horizontal and diagonal resistance but broke out on February 25. The breakout led to a new all-time high of $0.95 today. If the MNT upward movement continues, the price can increase by another 11% to $1.03.
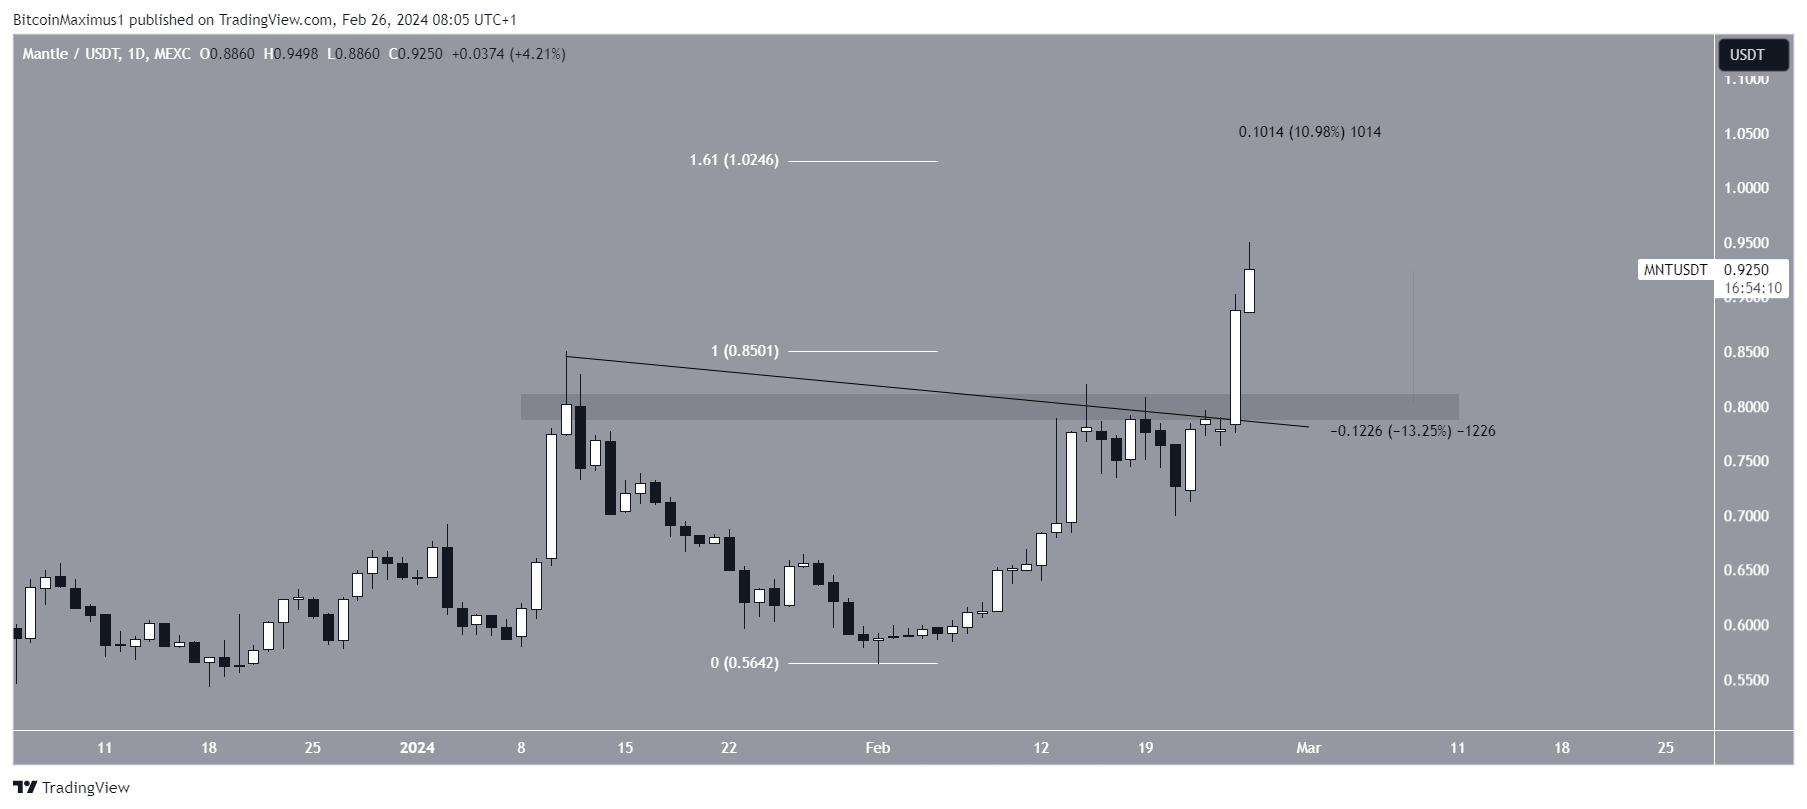
Despite the bullish MNT price prediction, failure to sustain the increase can trigger a 13% drop to the closest support at $0.80.
For BeInCrypto‘s latest crypto market analysis, click here.
Trusted
Disclaimer
In line with the Trust Project guidelines, this price analysis article is for informational purposes only and should not be considered financial or investment advice. BeInCrypto is committed to accurate, unbiased reporting, but market conditions are subject to change without notice. Always conduct your own research and consult with a professional before making any financial decisions. Please note that our Terms and Conditions, Privacy Policy, and Disclaimers have been updated.