
- USD/CAD could test a nine-day EMA of 1.3497 and a psychological level of 1.3500.
- The major level of 1.3450 and the 38.2% Fibonacci retracement level of 1.3442 could act as key support levels.
- A break above the 1.3600 level could lead the pair to test March’s high of 1.3605.
USD/CAD retraces its recent losses from the previous session, edging upwards to near 1.3480 during Thursday’s European session. The US Dollar (USD) receives support from higher US Treasury yields, likely influenced by recent data indicating sticky inflation in the United States (US).
The immediate resistance is at the nine-day Exponential Moving Average (EMA) at 1.3497, coinciding with the psychological level of 1.3500.
A breakout above the psychological level could provide upward support for the USD/CAD pair, with the next resistance at the major level of 1.3550. Further upside momentum may target the region around the psychological level of 1.3600, aligned with March’s high of 1.3605.
On the downside, the USD/CAD pair may encounter significant support around the major level of 1.3450, followed by the 38.2% Fibonacci retracement level at 1.3442. A breach below this level could exert downward pressure on the pair, potentially leading it toward the support zone near the previous week’s low of 1.3419 and the psychological level of 1.3400.
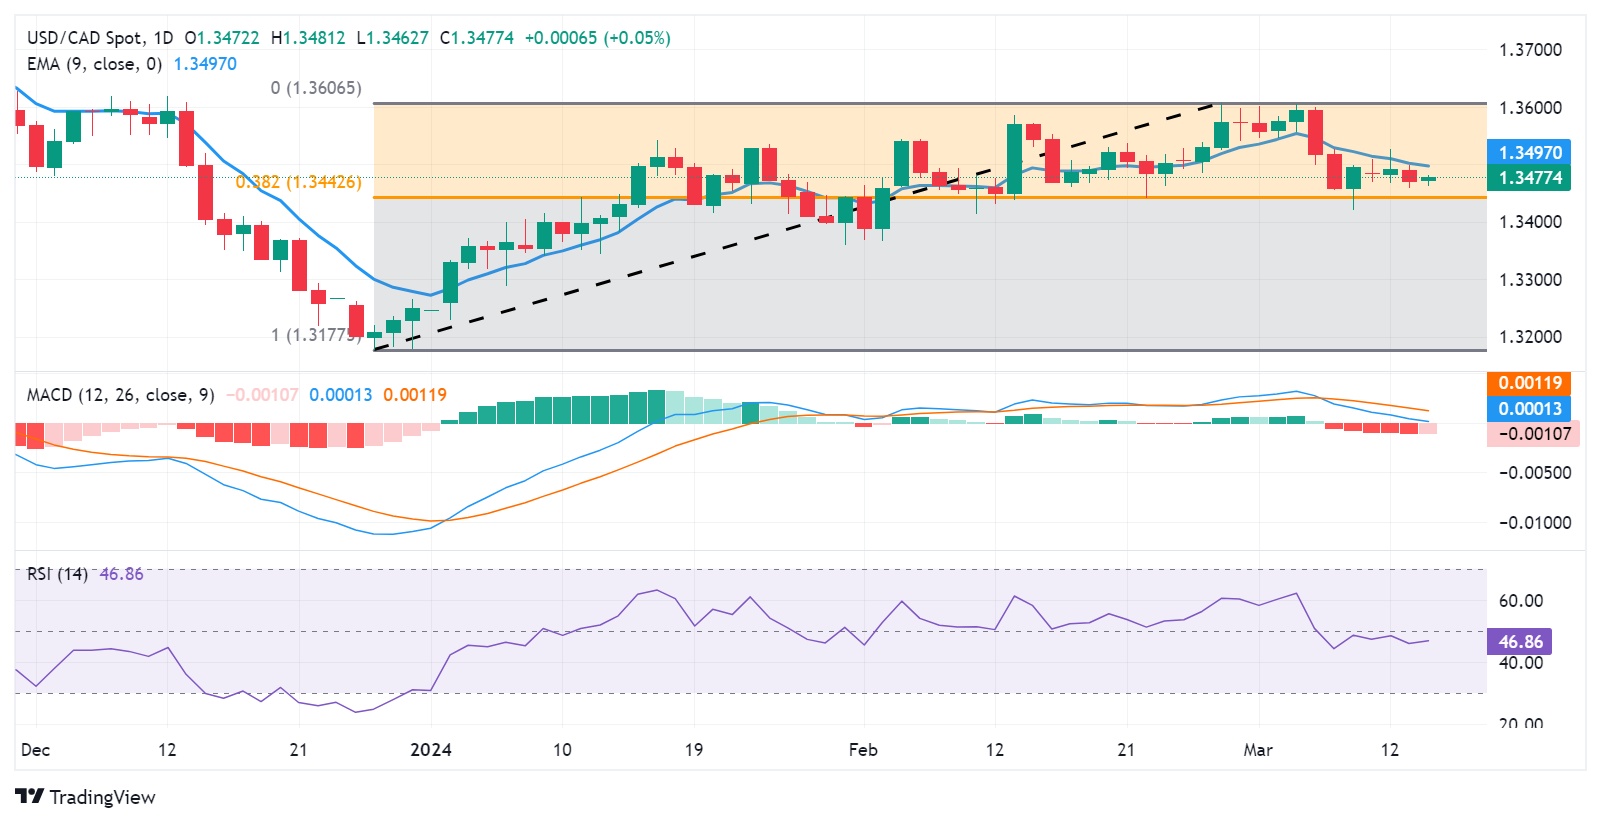
The technical analysis indicates mixed signals for the USD/CAD pair. The 14-day Relative Strength Index (RSI) is positioned below 50, suggesting bearish momentum. However, the Moving Average Convergence Divergence (MACD) suggests a potential momentum shift.
The MACD line is above the centerline, indicating bullish momentum, but there is divergence below the signal line. Traders may await confirmation from the MACD, a lagging indicator, to determine the direction of the trend.
USD/CAD: Daily Chart
Information on these pages contains forward-looking statements that involve risks and uncertainties. Markets and instruments profiled on this page are for informational purposes only and should not in any way come across as a recommendation to buy or sell in these assets. You should do your own thorough research before making any investment decisions. FXStreet does not in any way guarantee that this information is free from mistakes, errors, or material misstatements. It also does not guarantee that this information is of a timely nature. Investing in Open Markets involves a great deal of risk, including the loss of all or a portion of your investment, as well as emotional distress. All risks, losses and costs associated with investing, including total loss of principal, are your responsibility. The views and opinions expressed in this article are those of the authors and do not necessarily reflect the official policy or position of FXStreet nor its advertisers. The author will not be held responsible for information that is found at the end of links posted on this page.
If not otherwise explicitly mentioned in the body of the article, at the time of writing, the author has no position in any stock mentioned in this article and no business relationship with any company mentioned. The author has not received compensation for writing this article, other than from FXStreet.
FXStreet and the author do not provide personalized recommendations. The author makes no representations as to the accuracy, completeness, or suitability of this information. FXStreet and the author will not be liable for any errors, omissions or any losses, injuries or damages arising from this information and its display or use. Errors and omissions excepted.
The author and FXStreet are not registered investment advisors and nothing in this article is intended to be investment advice.