Canadian Dollar middles on Monday, BoC CPI inflation around the corner

- Canadian Dollar mostly higher but flat against Greenback again.
- Canada brings BoC CPI inflation to the table on Tuesday.
- Fedspeak dominates headlines, CAD volumes thin on holiday Monday.
The Canadian Dollar (CAD) was broadly higher on Monday before a moderating pullback halfway through the American trading session. Momentum remains limited with Canadian markets shuttered for the Victoria Day holiday. CAD traders will officially kick the trading week off on Tuesday, just in time for the Bank of Canada’s (BoC) latest Consumer Price Index (CPI) inflation.
Canada is taking the day off, leaving Fedspeak the key market force on Monday as Federal Reserve (Fed) officials make a slew of appearances. Fed policymakers are walking a fine line between hawkish and bullish as the US central bank tries to balance sky-high market expectations for rate cuts with a mixed data outlook. The Fed remains concerned that inflation could remain a tricky problem to solve, but investors are adamant that the Fed is due for a first rate cut in September.
Daily digest market movers: Canadian Dollar finds room to grow, but limited against Greenback
- Canadian Dollar recovers ground, but Greenback takes top spot on Monday, climbing higher and further.
- Fed speakers flood the newswires on Monday, stressing the need for patience on rate moves with inflation expected by Fed staff to remain too high for too long.
- Canada’s CPI inflation for the year ended April is expected to tick down to 2.7% from 2.9%.
- The BoC’s own Core CPI inflation tracker last came in at 2.0% YoY.
- Tuesday will feature even more Fed appearances, filling investors’ viewports.
- Fed officials speak cautiously on policy outlook after April inflation report
Canadian Dollar PRICE Today
The table below shows the percentage change of Canadian Dollar (CAD) against listed major currencies today. Canadian Dollar was the strongest against the New Zealand Dollar.
| USD | EUR | GBP | JPY | CAD | AUD | NZD | CHF | |
|---|---|---|---|---|---|---|---|---|
| USD | 0.03% | -0.08% | 0.30% | 0.02% | 0.28% | 0.36% | 0.02% | |
| EUR | -0.03% | -0.15% | 0.31% | -0.01% | 0.28% | 0.34% | -0.01% | |
| GBP | 0.08% | 0.15% | 0.32% | 0.14% | 0.42% | 0.47% | 0.13% | |
| JPY | -0.30% | -0.31% | -0.32% | -0.29% | -0.01% | 0.08% | -0.27% | |
| CAD | -0.02% | 0.00% | -0.14% | 0.29% | 0.22% | 0.34% | 0.00% | |
| AUD | -0.28% | -0.28% | -0.42% | 0.01% | -0.22% | 0.05% | -0.29% | |
| NZD | -0.36% | -0.34% | -0.47% | -0.08% | -0.34% | -0.05% | -0.34% | |
| CHF | -0.02% | 0.00% | -0.13% | 0.27% | -0.00% | 0.29% | 0.34% |
The heat map shows percentage changes of major currencies against each other. The base currency is picked from the left column, while the quote currency is picked from the top row. For example, if you pick the Canadian Dollar from the left column and move along the horizontal line to the US Dollar, the percentage change displayed in the box will represent CAD (base)/USD (quote).
Technical analysis: Canadian Dollar high, but Greenback even higher
The Canadian Dollar (CAD) gained ground against nearly all of its major currency peers, but buying pressure evaporated, leaving the CAD in middle ground on Monday. On the low side, the CAD shed around a tenth of a percent against the market’s Monday top performers, the Pound Sterling (GBP) and the US Dollar (USD).
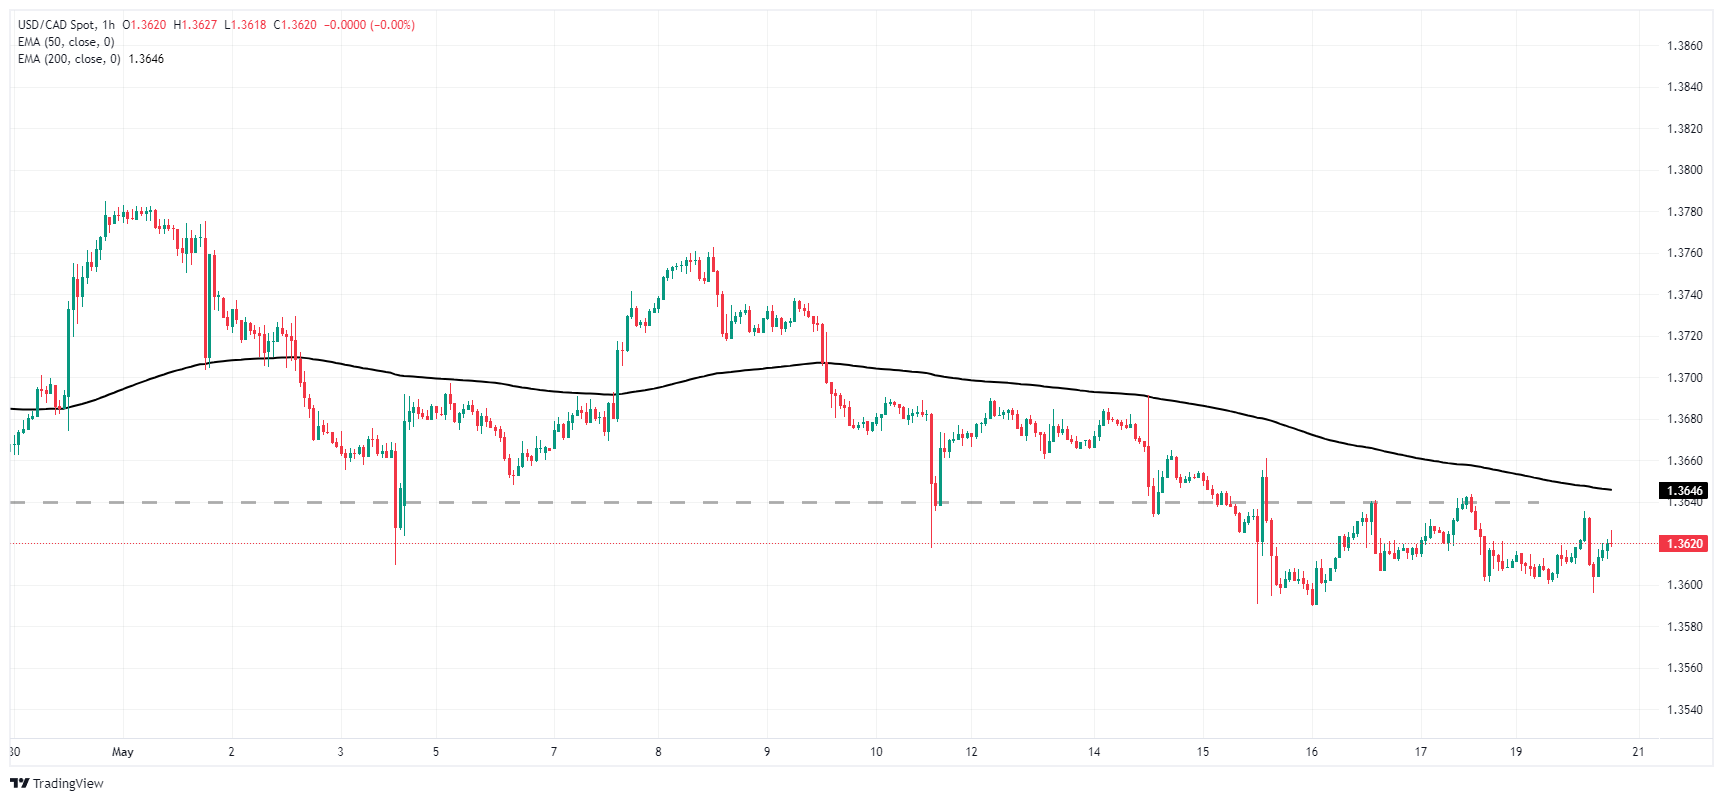
USD/CAD continues to go sideways in the near term, treading choppy water between 1.3640 and the 1.3600 handle. Intraday price action remains hampered by the 200-hour Exponential Moving Average (EMA) at 1.3646.
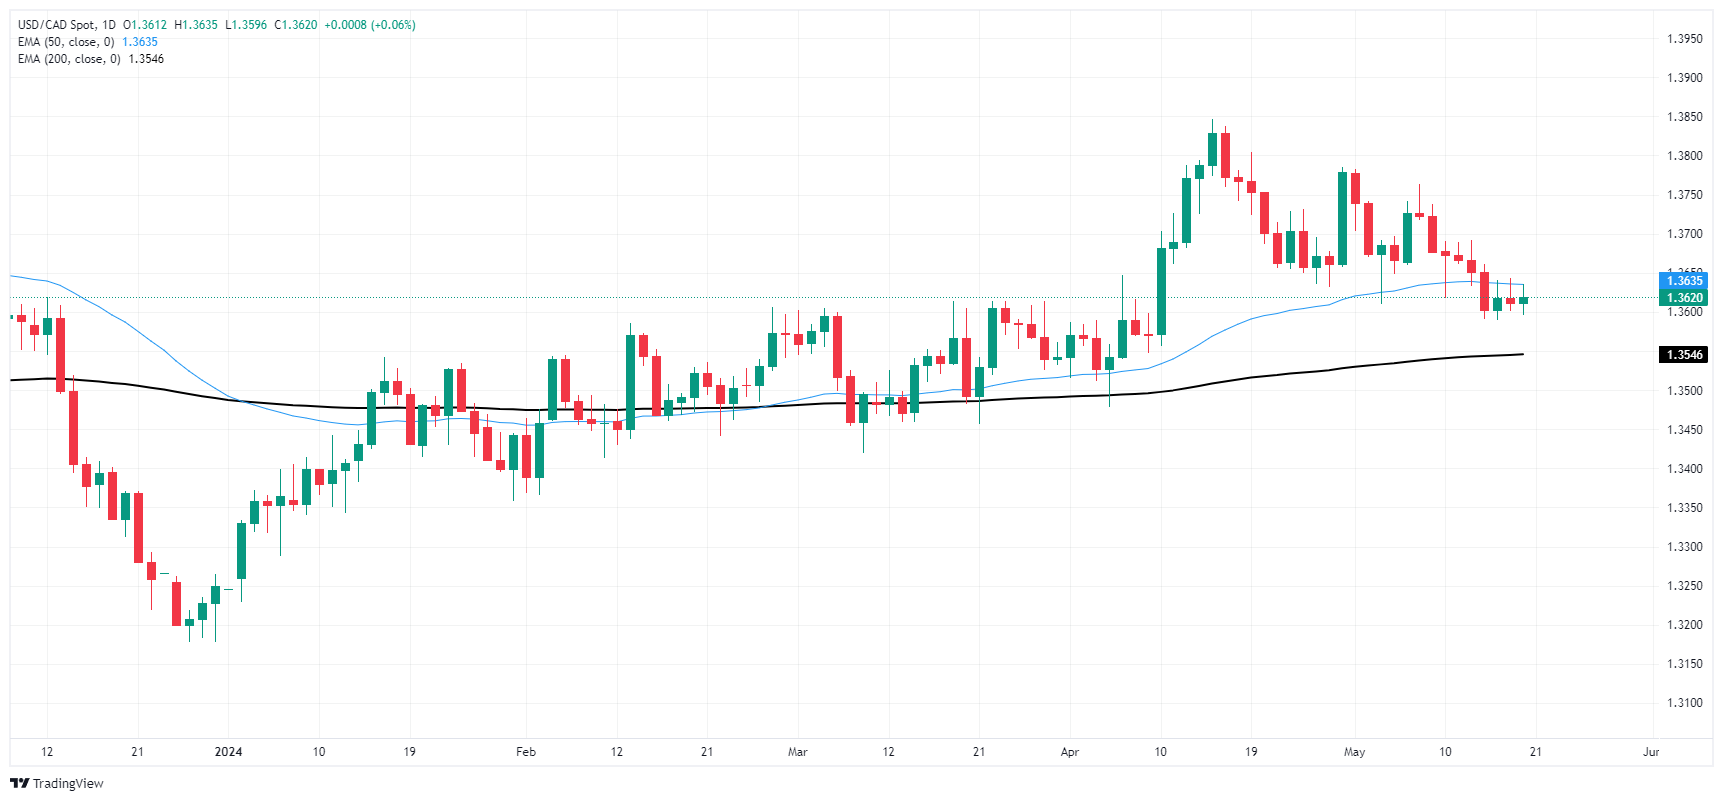
Middling technical action threatens to bake into USD/CAD with daily candlesticks stuck between the 50-day and 200-day EMAs at 1.3635 and 1.3548, respectively. The 1.3600 handle remains a key technical barrier, acting as a magnet pulling down bullish momentum and a price floor hobbling further shortside progress.
USD/CAD hourly chart
USD/CAD daily chart
Economic Indicator
Consumer Price Index (YoY)
The Consumer Price Index (CPI), released by Statistics Canada on a monthly basis, represents changes in prices for Canadian consumers by comparing the cost of a fixed basket of goods and services. The YoY reading compares prices in the reference month to the same month a year earlier. Generally, a high reading is seen as bullish for the Canadian Dollar (CAD), while a low reading is seen as bearish.
Next release: Tue May 21, 2024 12:30
Frequency: Monthly
Consensus: 2.7%
Previous: 2.9%
Source: Statistics Canada
Information on these pages contains forward-looking statements that involve risks and uncertainties. Markets and instruments profiled on this page are for informational purposes only and should not in any way come across as a recommendation to buy or sell in these assets. You should do your own thorough research before making any investment decisions. FXStreet does not in any way guarantee that this information is free from mistakes, errors, or material misstatements. It also does not guarantee that this information is of a timely nature. Investing in Open Markets involves a great deal of risk, including the loss of all or a portion of your investment, as well as emotional distress. All risks, losses and costs associated with investing, including total loss of principal, are your responsibility. The views and opinions expressed in this article are those of the authors and do not necessarily reflect the official policy or position of FXStreet nor its advertisers. The author will not be held responsible for information that is found at the end of links posted on this page.
If not otherwise explicitly mentioned in the body of the article, at the time of writing, the author has no position in any stock mentioned in this article and no business relationship with any company mentioned. The author has not received compensation for writing this article, other than from FXStreet.
FXStreet and the author do not provide personalized recommendations. The author makes no representations as to the accuracy, completeness, or suitability of this information. FXStreet and the author will not be liable for any errors, omissions or any losses, injuries or damages arising from this information and its display or use. Errors and omissions excepted.
The author and FXStreet are not registered investment advisors and nothing in this article is intended to be investment advice.


