
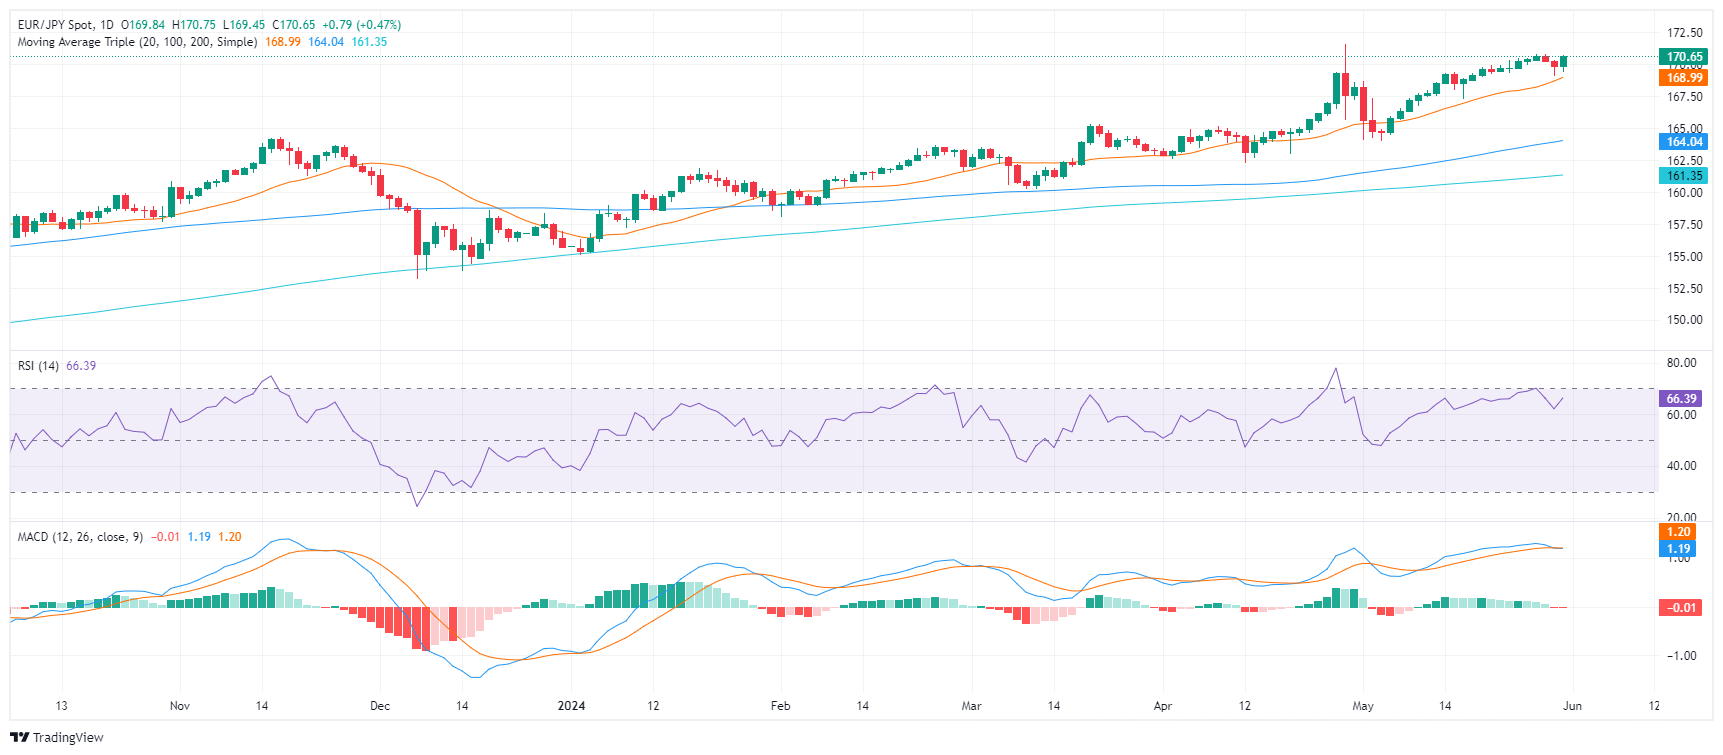
- The daily RSI is pointing upwards, hovering around 70, but continuing red bars in the MACD show a trailing consolidation.
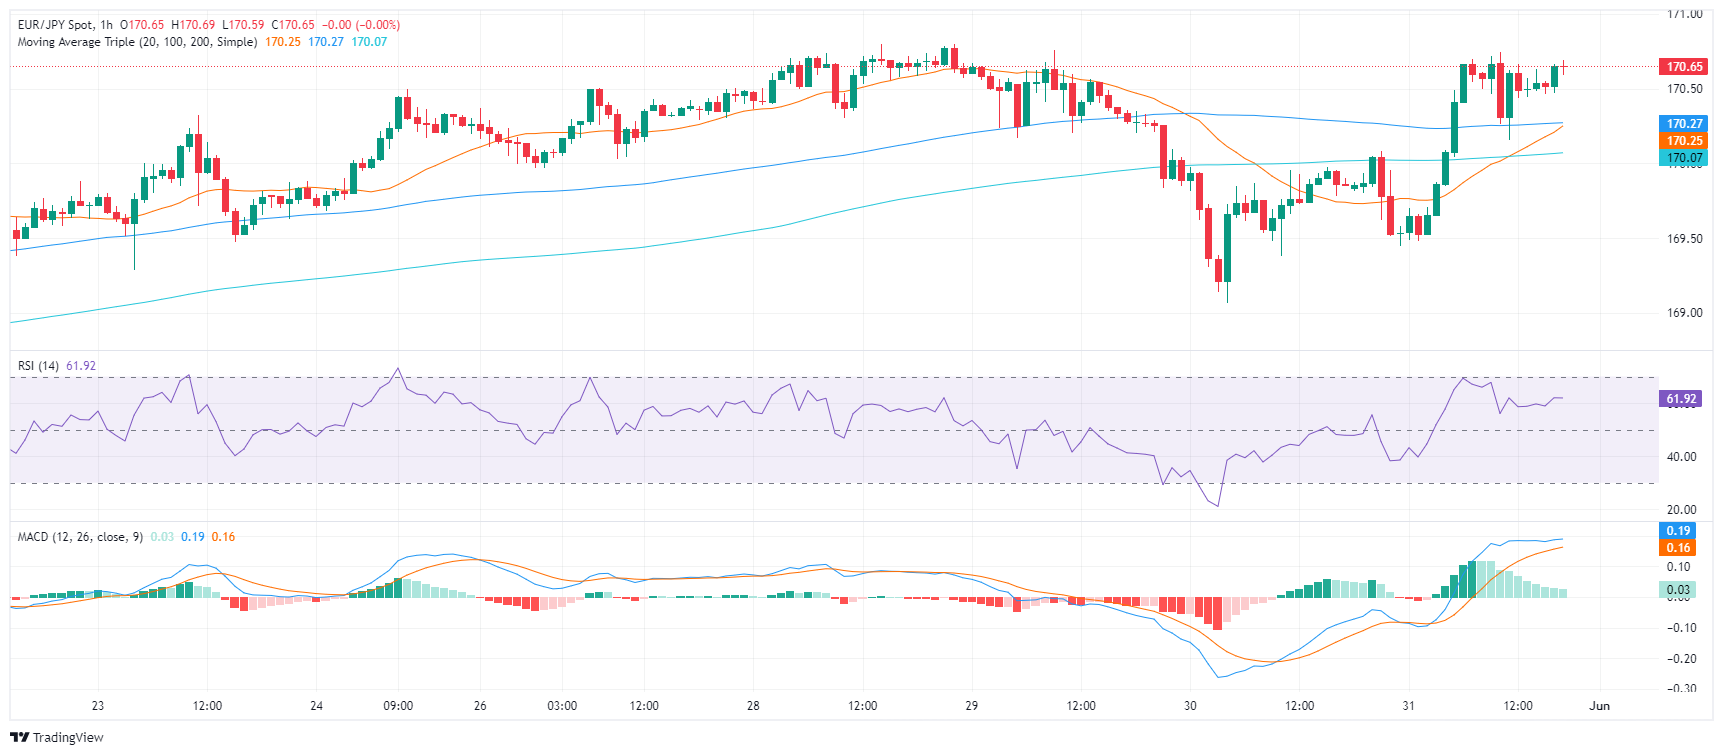
- On the hourly chart, indicators are neutral and reside in the positive terrain.
- The 20-day SMA at 169.00 serves as an important threshold for sellers.
On Friday’s trading session, despite recent downside corrections, the EUR/JPY pair managed to reclaim its stance above 170.00. This indicates a shifting of the bearish momentum observed on Thursday when the pair marked a daily low at 169.00.
The daily Relative Strength Index (RSI) has pivoted, now pointing upwards near 70, suggesting a possible reversal. However, the MACD is still printing red bars, confirming that the pair is in a consolidation phase with limited upside. These mixed signals necessitate following the pair closely to determine if this marks a fresh bullish momentum or merely a pause in a more pronounced downward correction.
EUR/JPY daily chart
On the hourly chart, indicators are maintaining their neutrality, inhabiting the positive territory. This could potentially point to a subtle strengthening of bullish sentiment despite the ongoing consolidation phase.
EUR/JPY hourly chart
Critically, the position of the EUR/JPY pair continues to hover above the significant SMAs. The 20-day SMA at 169.00 in particular stands out as a crucial threshold and sellers must conquer this level to flip the near-term bullish outlook. Should the position fall below this key support level, the 100 and 200-day SMAs provide further safety barriers for potential sellers.
Information on these pages contains forward-looking statements that involve risks and uncertainties. Markets and instruments profiled on this page are for informational purposes only and should not in any way come across as a recommendation to buy or sell in these assets. You should do your own thorough research before making any investment decisions. FXStreet does not in any way guarantee that this information is free from mistakes, errors, or material misstatements. It also does not guarantee that this information is of a timely nature. Investing in Open Markets involves a great deal of risk, including the loss of all or a portion of your investment, as well as emotional distress. All risks, losses and costs associated with investing, including total loss of principal, are your responsibility. The views and opinions expressed in this article are those of the authors and do not necessarily reflect the official policy or position of FXStreet nor its advertisers. The author will not be held responsible for information that is found at the end of links posted on this page.
If not otherwise explicitly mentioned in the body of the article, at the time of writing, the author has no position in any stock mentioned in this article and no business relationship with any company mentioned. The author has not received compensation for writing this article, other than from FXStreet.
FXStreet and the author do not provide personalized recommendations. The author makes no representations as to the accuracy, completeness, or suitability of this information. FXStreet and the author will not be liable for any errors, omissions or any losses, injuries or damages arising from this information and its display or use. Errors and omissions excepted.
The author and FXStreet are not registered investment advisors and nothing in this article is intended to be investment advice.