Dow Jones Industrial Average climbs in NFP-fueled risk appetite recovery

- The Dow Jones recovered ground on NFP Friday, but still remains down on the week..
- The US added far more jobs than expected in September.
- Market hopes for a follow-up jumbo cut from the Fed have collapsed.
The Dow Jones Industrial Average (DJIA) rallied after US Nonfarm Payrolls (NFP) jobs figures blew past expectations. US NFP net job gains soared to 254K on Friday, cudgeling market hopes for a second double-wide rate cut from the Federal Reserve (Fed) on November 7.
The US Unemployment Rate dropped back to 4.1% from the previous 4.2%, further reinforcing a healthier-than-expected landscape in the US labor market. In addition, several months’ worth of NFP releases saw healthy upside revisions. August’s previous NFP total was lifted by an additional 17K, while July’s figure rose sharply by 55K, bringing the total up to 144K.
Annual wage growth also firmed up in September, rising 4.0% YoY from the previous 3.9%. Investors had expected September’s Average Hourly Earnings growth to ease back to 3.8%. With wages and net jobs additions blowing well past expectations across the board, rate market expectations of a higher pace of rate cuts have taken a huge hit to round out a middling-at-best trading week.
According to the CME’s FedWatch Tool, rate trader expectations for the Fed’s November rate call plummeted post-NFP; rate futures speculators now see a 95% chance that the Fed will trim rates by a modest 25 bps on November 7, with the last 5% betting on no movement at all on the Fed funds rate.
Dow Jones news
Despite a moderate recovery after a bumper NFP print, the Dow Jones only saw a tempered rally. The index broadly rallied on reaction to US jobs figures, rising nearly 400 points bottom-to-top, but the index has settled to a more reasonable 200-point gain.
Two-thirds of the Dow Jones’ constituent securities rose on Friday, led by JPMorgan Chase (JPM). JPMorgan rallied 3% on the day, climbing over $210 per share. On the low side, Home Depot (HD) backslid 1% to $407 per share.
In other stock news, Amazon (AMZN) rose nearly 2% on Friday, clipping into $185 per share on the back of upbeat jobs data and the rapid resolution of the East Coast dock worker’s strike.
Dow Jones price forecast
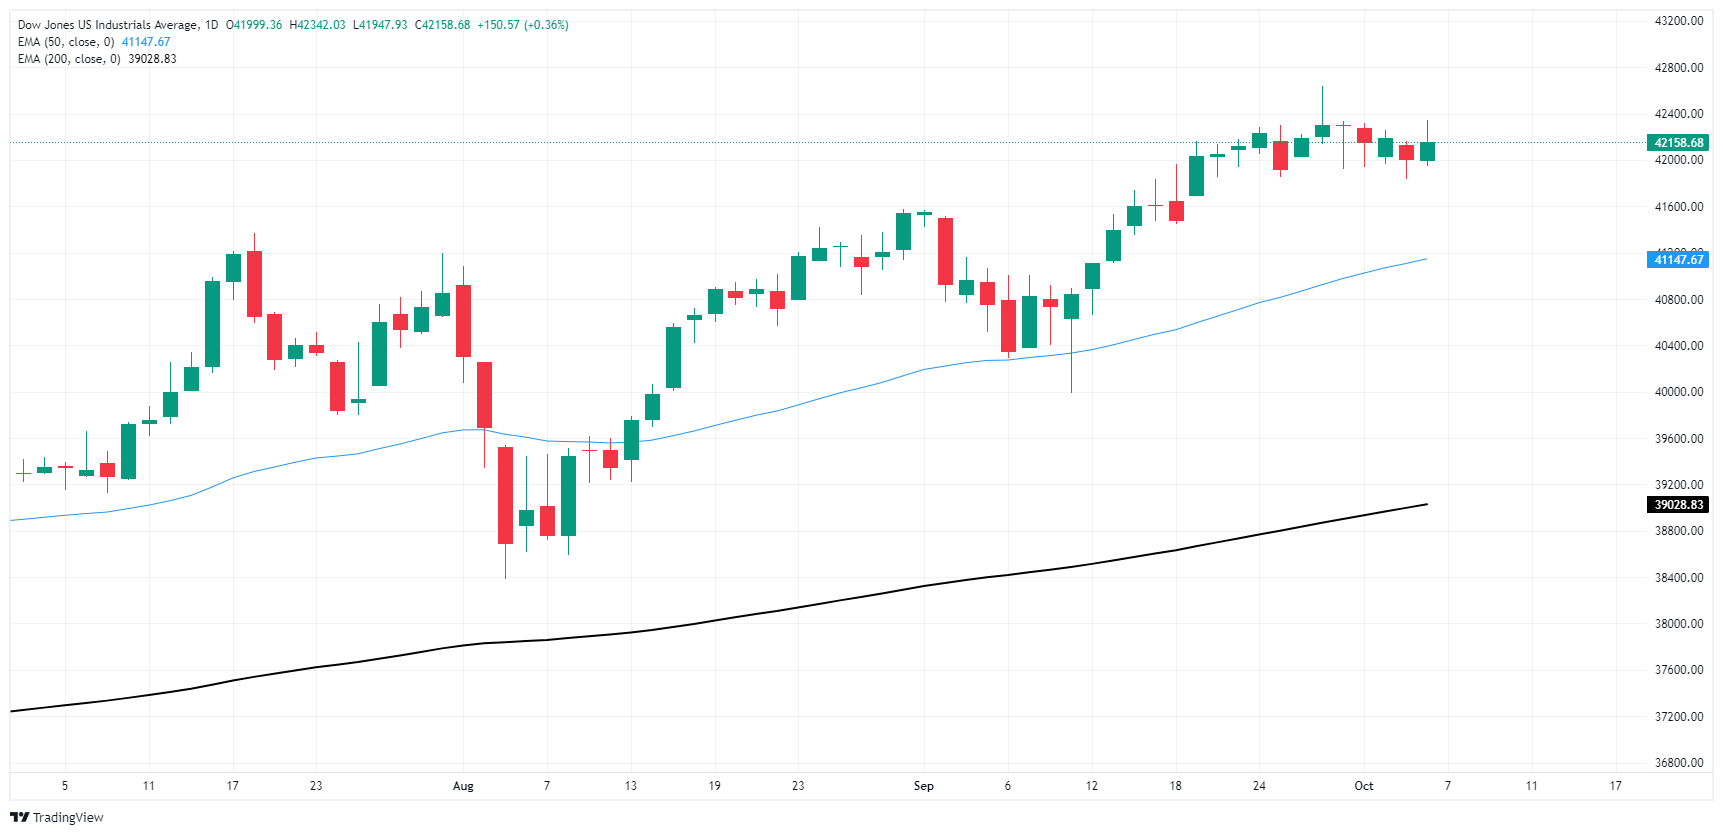
The Dow Jones is on an upward trajectory overall, nearing a crucial resistance level while technical indicators suggest positive momentum in the market. The index is currently hovering around 42,200, a point at which it has previously encountered selling pressure. traders are watching to see whether the Dow can surpass this resistance, a move that could open the door to further advances in the short term.
Despite the overall positive trend, recent price movements reflect uncertainty. Daily candles have been switching between bullish and bearish, indicating that the market is taking a pause as it tests the resistance level.
“We are currently at a critical juncture in the market. A clean breakout above this resistance might generate renewed buying interest,” remarked one technical analyst. “However, if the Dow fails to overcome this level, we may witness a retreat toward the moving averages.”
Dow Jones daily chart
Economic Indicator
Unemployment Rate
The Unemployment Rate, released by the US Bureau of Labor Statistics (BLS), is the percentage of the total civilian labor force that is not in paid employment but is actively seeking employment. The rate is usually higher in recessionary economies compared to economies that are growing. Generally, a decrease in the Unemployment Rate is seen as bullish for the US Dollar (USD), while an increase is seen as bearish. That said, the number by itself usually can’t determine the direction of the next market move, as this will also depend on the headline Nonfarm Payroll reading, and the other data in the BLS report.
Information on these pages contains forward-looking statements that involve risks and uncertainties. Markets and instruments profiled on this page are for informational purposes only and should not in any way come across as a recommendation to buy or sell in these assets. You should do your own thorough research before making any investment decisions. FXStreet does not in any way guarantee that this information is free from mistakes, errors, or material misstatements. It also does not guarantee that this information is of a timely nature. Investing in Open Markets involves a great deal of risk, including the loss of all or a portion of your investment, as well as emotional distress. All risks, losses and costs associated with investing, including total loss of principal, are your responsibility. The views and opinions expressed in this article are those of the authors and do not necessarily reflect the official policy or position of FXStreet nor its advertisers. The author will not be held responsible for information that is found at the end of links posted on this page.
If not otherwise explicitly mentioned in the body of the article, at the time of writing, the author has no position in any stock mentioned in this article and no business relationship with any company mentioned. The author has not received compensation for writing this article, other than from FXStreet.
FXStreet and the author do not provide personalized recommendations. The author makes no representations as to the accuracy, completeness, or suitability of this information. FXStreet and the author will not be liable for any errors, omissions or any losses, injuries or damages arising from this information and its display or use. Errors and omissions excepted.
The author and FXStreet are not registered investment advisors and nothing in this article is intended to be investment advice.


