Solana (SOL) Defies Crypto Market Trends, Eyes $190 Level


The ongoing selling pressure across the cryptocurrency market has shifted the overall sentiment toward a downtrend. In this, Solana (SOL), the world’s fifth biggest cryptocurrency by market cap is gaining notable attention from crypto enthusiasts as it holds itself positive in terms of price changes in the past 24 hours.
Solana Beat Bitcoin and Ethereum
In addition to this, SOL has outperformed major cryptocurrencies like Bitcoin (BTC), Ethereum (ETH), and Binance Coin (BNB). At press time, SOL is trading near $172 and has experienced a price surge of over 3.4% in the past 24 hours. During the same period, its trading volume declined by 20%, indicating fear among traders and investors likely due to the current market condition.
Solana Technical Analysis and Upcoming Level
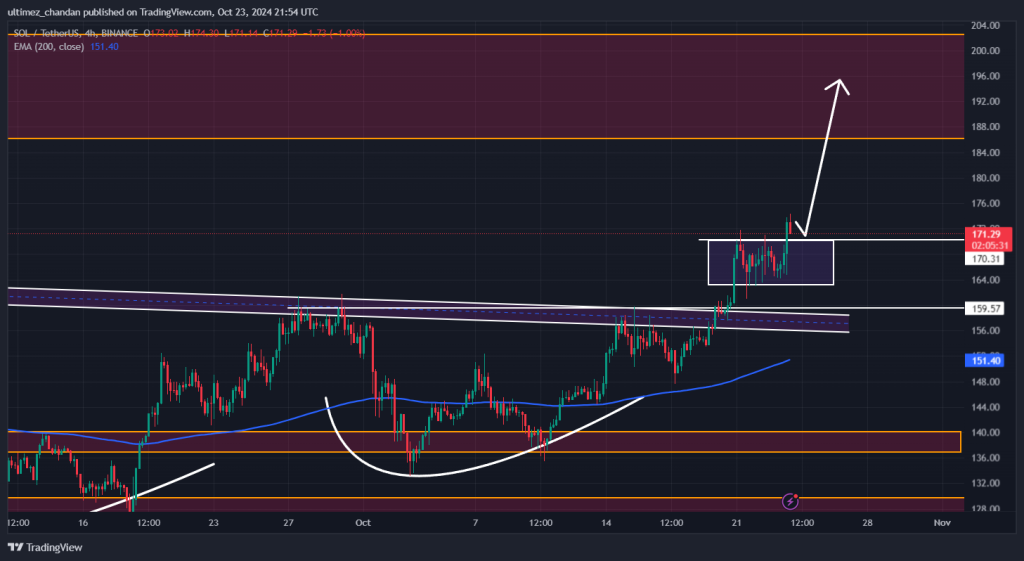
According to expert technical analysis, SOL appears bullish. It recently broke out from a two-day strong consolidation between the $162 and $170 levels. Following this breakout, it could soar by 10% to reach the $190 level in the coming days.

As of now, SOL is trading above the 200 Exponential Moving Average (EMA) on a daily time frame, indicating an uptrend.
With this recent breakout, short sellers have liquidated nearly $3.5 million worth of short positions, whereas bulls have registered a liquidation of $350,000. This liquidation shows that bears are currently exhausted.
Bullish On-Chain Metrics
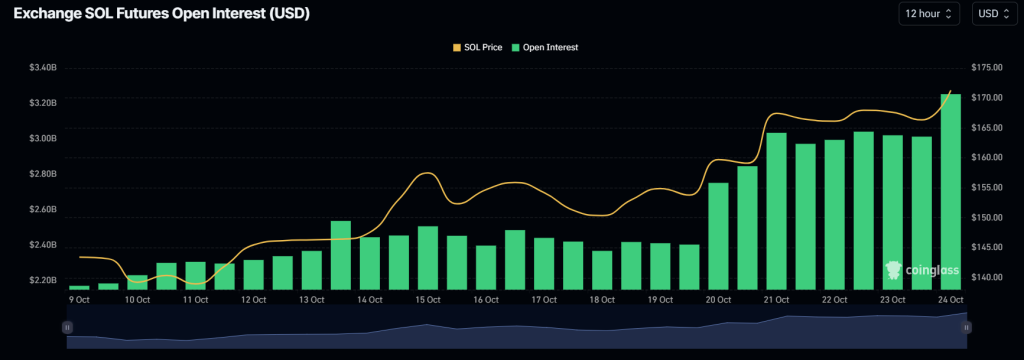
SOL’s bullish outlook is further supported by on-chain metrics. According to an on-chain analytics firm CoinGlass, SOL’s Long/Short ratio currently stands at 1.02, indicating a strong bullish market sentiment among traders. Additionally, its open interest has jumped by 11%, indicating buildups of new positions likely due to the recent consolidation breakout.

Traders and investors often consider the rising open interest and a long/short ratio above 1, when building long positions. Combining these on-chain metrics with technical analysis, it appears that bulls are currently dominating the asset and may support bulls to achieve the target.


